Topics in Photographic Preservation 2007, Volume 12, Article 29 (pp. 211-223)
Portions of this paper were presented at the 2007 Conservation Science Conference held at the Politecnico di Milano, Milan, Italy, 10 – 11 May 2007.
This paper presents non-destructive, non-invasive, and non-contact techniques of optical and surface metrology applied to surface studies of daguerreotypes. Daguerreotypes are positive images developed directly on the surface of silvered copper plates. The image is a sub-micron, ultra-fine-structured surface that exceeds the resolving power of the optical microscope for surface examination and evaluation. White light confocal microscopy is shown to be a useful technique for examining the 3D ultra-fine structure of the daguerreotype image. This technique provides quantitative information of surface characteristics using established surface roughness parameters to document the daguerreotype surface. Examination at this level can measure changes due to environmentally induced deterioration, and provide comparative data of before and after chemical and physical treatment. Confocal microscopy shows considerable potential in assisting the conservator to evaluate both daguerreotype condition and treatments performed on the fragile image structure.
Today the daguerreotype is increasingly treasured for both its fine art and artifactual value in addition to its documentary record. The daguerreotype presents photograph conservators and conservation scientists with a significant challenge for long-term preservation. The material science of the daguerreotype, the precise make-up of its image surface ultra-fine structure and image altering deterioration mechanisms have not been fully researched. An ultra-fine structure refers to materials with a particle size below about 1 micron (μm). Sub-micron materials are for particle sizes between 100 nanometers (nm) and 1 μm, and nano-structured materials are between 2 nm and 100 nm. Adverse environmental conditions, contaminants and pollutants, and physical interaction can severely damage the image's ultra-fine structure. From their inception, chemical, and electrochemical treatments have been used to restore daguerreotypes; however, there has been no comprehensive and authoritative scientific evaluation of the effects of these treatments on the image structure. The ethics and methods of restorative treatments on daguerreotypes remain an area of serious debate within the conservation community.
Briefly, the photographic process presented in 1839 by Daguerre involved the following steps.
In this early process, the daguerreotype image is an extremely delicate silver-mercury amalgam that could be physically disturbed easily. In 1840, Armand Hippolyte Louis Fizeau (1819–1896) introduced a sixth step, commonly referred to as “gilding.” In this step, gold is deposited electrochemically on the surface in a gold-chloride solution, which often is heated locally. Fizeau claimed that gilding served two purposes: it affixed the silver-mercury amalgam image particles to the surface, and made the highlights appear whiter and the shadow areas seem darker (Fizeau 1840). From that point on, gilding was incorporated into the process.
The daguerreotype image is formed by a diffuse light scattering phenomenon resulting from mercury vapor selectively depositing in areas of light exposure, directly proportional to the reduced silver of the latent image. The highlight areas have the highest density of sub-micron particles, which contrasts with shadows and dark areas where there is no particle deposition. As a result, the shadows and dark areas on the polished silver plate appear dark when viewed by oblique light. The full nature of the image is the result of the complex interaction of the surrounding illumination, the surface optics (reflective properties), and the surface geometry (Motoyoshi et al. 2007). The interaction of light and the daguerreotype surface has been described well by Barger and White (1991).
Optical and surface metrology provides non-invasive, non-contact, and non-destructive techniques for surface examination of original historic and artistic works (Grynszpan et al. 2004; Wei et al. 2005; Sotiropoulo and Wei 2006). This paper focuses on the application of the optical and surface metrology technique of confocal microscopy to the study of daguerreotype surfaces. Confocal microscopy offers the ability to image surface features, allowing one to visually experience the 3D nature of small-scale features on the surface. It is ideally suited to examine the surface geometry of the daguerreotype image independently from the illumination and reflectance factors, thereby providing quantitative metrics of the surface ultra-fine structure.
This study is part of a broader research initiative to advance examination techniques and material studies of the daguerreotype currently being undertaken collaboratively with the George Eastman House International Museum of Photography & Film (Rochester, NY), the Metropolitan Museum of Art (New York, NY), and the Museum of Fine Arts (Boston, MA). These three museums contributed significantly to the recent major retrospective, organized by George Eastman House, entitled Young America - the Daguerreotypes of Southworth & Hawes. Albert Sands Southworth and Josiah Johnson Hawes of Boston are considered pre-eminent masters of the American daguerreotype. An extraordinary image-based condition-monitoring program for this exhibition documented condition changes and raised, anew, concerns about the vulnerability and reactivity of the daguerreotype surface. The holders of these masterpieces are formulating a research agenda to understand better image formation and stability of the daguerreotype, develop quantitative techniques for assessing condition, and establish condition reference baselines.
The confocal microscope used in this research was the NanoFocus μsurf Confocal Microscope (NanoFocus AG, Lindnerstr. 98, D-46149 Oberhausen, Germany, Telephone: +49(0)208 62 000–0, email: info@nanofocus.de; NanoFocus, Inc., 4470 Cox Road, Suite 250, Glen Allen, VA 23060, Telephone: 1–804-228–4195, ext. 217; Fax: 1–804-527–1816; www.nanofocus.info). With a 10x objective with a numerical aperture of 0.3, the microscope provides 3D surface data arrays of 512 × 512 points covering an area of 1.55 × 1.55 square millimeters (mm2) that are represented graphically by contour and isometric maps. In addition to using the μsurf Version 6.1 software for operating the microscope, μsurf Version 6.1 was used for analysis. Confocal microscopy only provides information on the geometry and physical structure of a surface; not its composition.
A daguerreotype from the Conservation Department Study Collections at the George Eastman House was chosen for examination. The sample is a 1/9th plate (48 × 60 mm2) portrait of an unknown seated woman, ca 1850, wearing a bonnet headdress. Prior to experimental protocol it had minor surface corrosion or tarnish.
The chemical reagents used in treatment were pharmaceutical-grade denatured ethanol (96%), food-grade ammonium hydroxide ((NH4OH, 10%), and tap water. The treatment consisted of immersing the right half in an ammonium hydroxide solution, 10 < pH < 10.5, for approximately 60 seconds.
Surface metrology is the study and measurement of small-scale features of surfaces by either contact or non-contact techniques. Optical metrology, as its name implies, uses light to measure distances. It has the advantage of allowing for variable distances in conducting measurements. Both confocal and interference microscopy are optical techniques that are non-perturbing (non-contact, non-invasive, and non-destructive) methods that provide 3D data of surfaces.
White light confocal microscopy, offers the ability to image surfaces thereby allowing one to visually experience the 3D nature of small-scale features. Confocal microscopy was developed in 1955 by Marvin Minsky (Minsky 1988). Minsky's work was not considered seriously until 20 years later (in the late 1970s) when it was realized that the depth or “z” resolution is greater than that of optical microscopy at the expense of a smaller field of view. This optical-sectioning or depth-discrimination property of confocal microscopy is its strength: its ability to capture the depth of a sample where the “z” direction is imaged at various heights and form a full 3D image from a stack of partial images (Gu 1996; Wilson 2002).
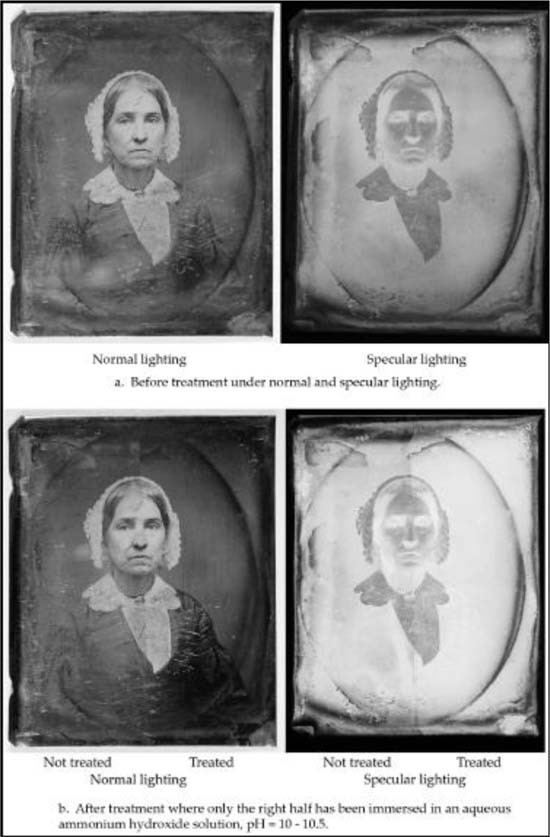
The daguerreotype portrait of the seated woman was examined before and after conservation treatment. The state of the plate before treatment is shown in Figure 1a, under normal and specular illumination. The specular image clearly shows a thin transparent brown film covering the entire plate, and a pronounced dark blue and brown tarnish found as an oval and on all four edges/borders of the plate. The oval shaped tarnish follows the opening of the decorative brass metal window mat.
The results of the conservation treatment of the plate, which consisted of immersing only the right half in an ammonium hydroxide solution for about 60 seconds, are shown in Figure 1b. The treatment appears to have completely removed the thin film of brown tarnish. The oval and edge areas show that the dark blue tarnish remains. It appears that the dark blue tarnish was unaffected by the ammonium hydroxide solution.
Figure 1. Daguerreotype, 1/9th plate, of a seated woman wearing a bonnet headdress ca. 1850s. a. Before treatment in normal and specular lighting; b. After treatment in normal and specular lighting.
Several different areas of the image were examined to document the types of surface changes taking place before and after treatment. Treating only the right half of the plate made it possible to examine transition areas, areas on the plate showing both untreated and treated sections, and to calculate approximate thicknesses of tarnish films. Figure 2 shows the four areas measuring 1.55 × 1.55 mm2 that were examined. Areas A and B show before and after treatment with ammonium hydroxide in the top right quadrant. Area A highlights the non-descriptive grey background area above the right side of the woman's head, and area B describes an area of extreme tarnish about half way between the woman's head and the edge of the plate. Area C, the woman's chin and neck area, and area D, a portion of her jacket and shirt at chest level, examine untreated and treated transition areas. In areas C and D two transition areas encompassing both untreated and treated sections are described. In both cases, the left half has remained untreated and the right side has been dipped in the ammonium hydroxide solution. Area C examines the woman's chin-neck area, which is composed of two different mid tone greys, and area D examines a region of greater contrast, a portion of the white shirt and dark jacket area.
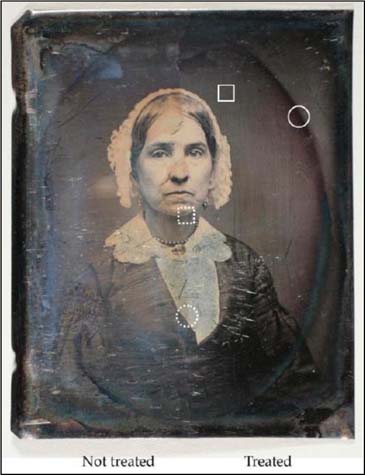
Figure 2. The four areas examined with the μsurf confocal microscope. The solid white square (Area A, □) is on a grey mid tone area; the solid white circle (Area B, ○) is on a portion of the dark blue tarnish oval; the broken line white square (Area C, broken □) is on the chin-neck area; and the broken circle (Area D, broken O) is on the jacket-shirt area. The broken square and broken circle show not-treated and treated transition areas.
As Figures 3a and 1b show, the grey background area examined before and after treatment (immersion in an ammonium hydroxide solution) shows there has been a considerable amount of change in the surface character. The main observable feature between the untreated and treated images is the disappearance of the surface roughness after immersion in the alkaline solution. The few remaining large and tall silver particles, seen as peaks in Figure 1b, offer a striking contrast to the before treatment view and of the thin brown tarnish layer that has been removed.
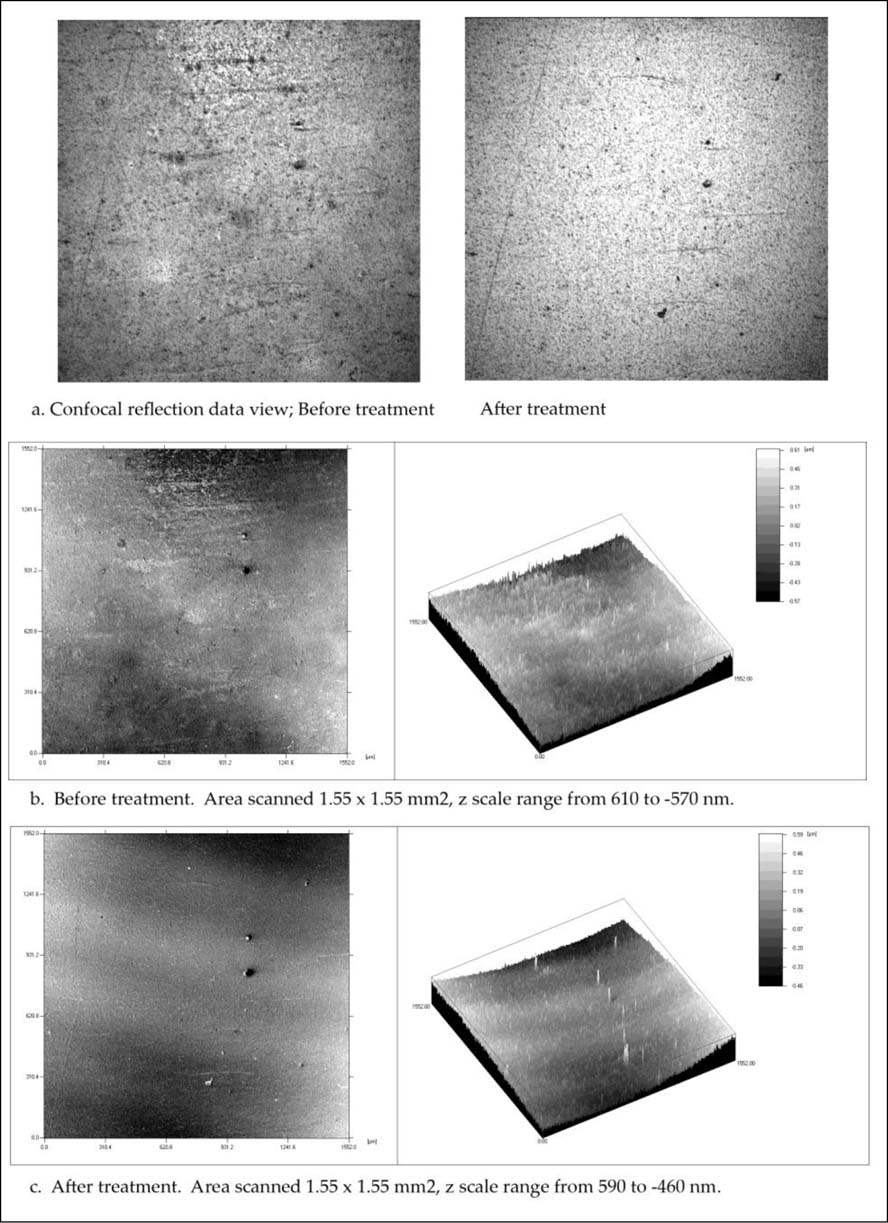
Figure 3. Grey mid tone background area close to the woman's head. a. Confocal reflection data views before and after treatment; b. Contour and isometric before treatment; and c. Contour and isometric after treatment with ammonium hydroxide, 10 < pH < 10.5.
Surface tarnish on daguerreotypes has been identified to be composed of several silver compounds such as silver sulfide, silver oxide, and silver chloride (Barger and White 1991; Centeno 2007). Some of the physical properties of silver tarnish compounds found on daguerreotypes are reviewed in Table 1. It is interesting to note that the colors of these salts–black for silver sulfide, dark brown for silver oxide, and white for silver chloride–could be used to identify visually the prevailing type of tarnish. These salts are insoluble in water but not in other aqueous solvents such as thiourea, thiosulfate, thiocyanide, cyanide, and ammonia. Ammonium hydroxide solubilizes silver chloride and silver oxide, but it is not strong enough for silver sulfide. Therefore, it is reasonable to state that the thin layer of brown tarnish removed from the right half of the daguerreotype when immersed in the ammonium hydroxide solution was composed mainly of silver oxide and some silver chloride.
Area B focuses on an extremely tarnished spot in the oval in the top right quadrant of figure 2. Figures 4a and 4b show contour and isometric views of the confocal data of the area before and after treatment, and Figure 4c shows profiles before and after treatment. Again, it can be seen that there has been a dramatic decrease in the surface character and roughness after treatment. Figures 1b and 2 shows the surface character after brown tarnish removal and figure 4b shows the remaining dark blue tarnish. The profiles in figure 4c also clearly show the change. From the not-treated profile, figure 4c before treatment, the height difference between lower and higher plateau of the dark blue tarnish is approximated to be 500 nm. This is the height of the dark blue tarnish layer. The treated side profile, figure 4c after treatment, shows the decrease after treatment and the height difference is estimated to be 50 nm. Comparison of these two differences allows us to state that after treatment with ammonium hydroxide, the surface height has diminished by about 90%, and that the removed layer of silver oxide and silver chloride is calculated to have been 450 nm thick.
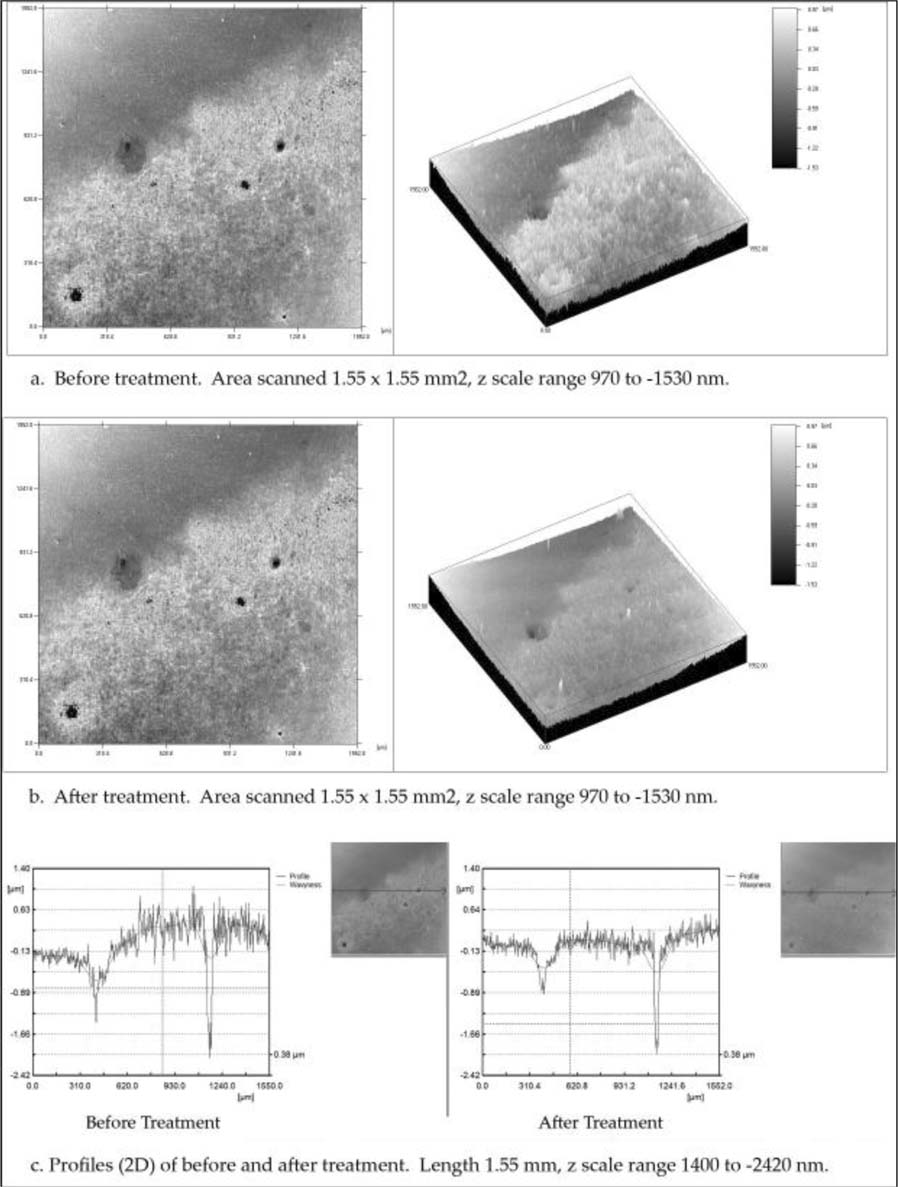
Figure 4. Tarnished area in the top right quadrant; contour and isometric views, and profiles (2D). a. Before treatment; b. After treatment with ammonium hydroxide, 10 < pH < 10.5; c. Profiles taken from the same position before and after treatment.
The insolubility of the dark blue tarnish in an ammonium hydroxide solution makes it likely to be silver sulfide, silver gold sulfide, or a combination of the two compounds. Ammonium hydroxide solutions are not solvents for silver sulfide. Studies on the tarnishing of gold on silver report that silver sulfide adsorbs more strongly to gold metal than to silver metal because of chemical interactions between silver sulfide and gold to form mixed silver gold sulfides, such as AuAgS or AuAg3S2 (Selwyn 2000; Dick et al. 1993). In addition, silver sulfide has been observed to spread from silver surfaces over and onto adjacent gold surfaces (Selwyn 2000; Egan and Mendizza 1960).
Table 1. General physical properties of silver tarnish compounds found on daguerreotypes
| Name | Chemical Formula | Color | Appearance (bulk) | Soluble | formula weight (amu) | |
| Silver sulfide | Ag2S | black | cubic crystal | Water - | NO | 247.8 |
| Ammonia - | NO | |||||
| NaThiosulfate - | YES | |||||
| KCyanide - | YES | |||||
| Silver (I) oxide (silver rust & argentous oxide) | Ag2O | dark brown to black | n.a. | Water - | NO | 231.7 |
| Ammonia - | YES | |||||
| NaThiosulfate - | YES | |||||
| KCyanide - | YES | |||||
| Silver chloride | AgCl | white | cubic crystal | Water - | NO | 143.3 |
| Ammonia - | YES | |||||
| NaThiosulfate - | YES | |||||
| KCyanide - | YES | |||||
The confocal data of the woman's chin-neck area are shown in Figures 5 and Figure 6. figure 5 presents dark field, contour, and isometric views of the untreated left half and the right half treated with ammonium hydroxide. In the dark field image (Figure 5, left), the top left dark triangular portion is the woman's chin and the lighter area below her neck. The wavy tide line in the center running from top to bottom delineates the untreated (left) and treated (right) halves. The right treated half appears brighter than the left untreated half.
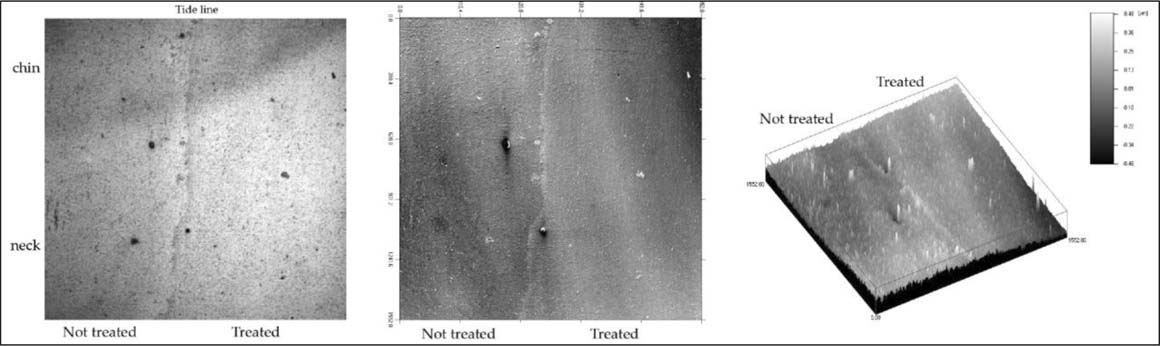
Figure 5. Low contrast transition area of the chin and neck in confocal reflection data, contour, and isometric views of treated and not-treated areas.
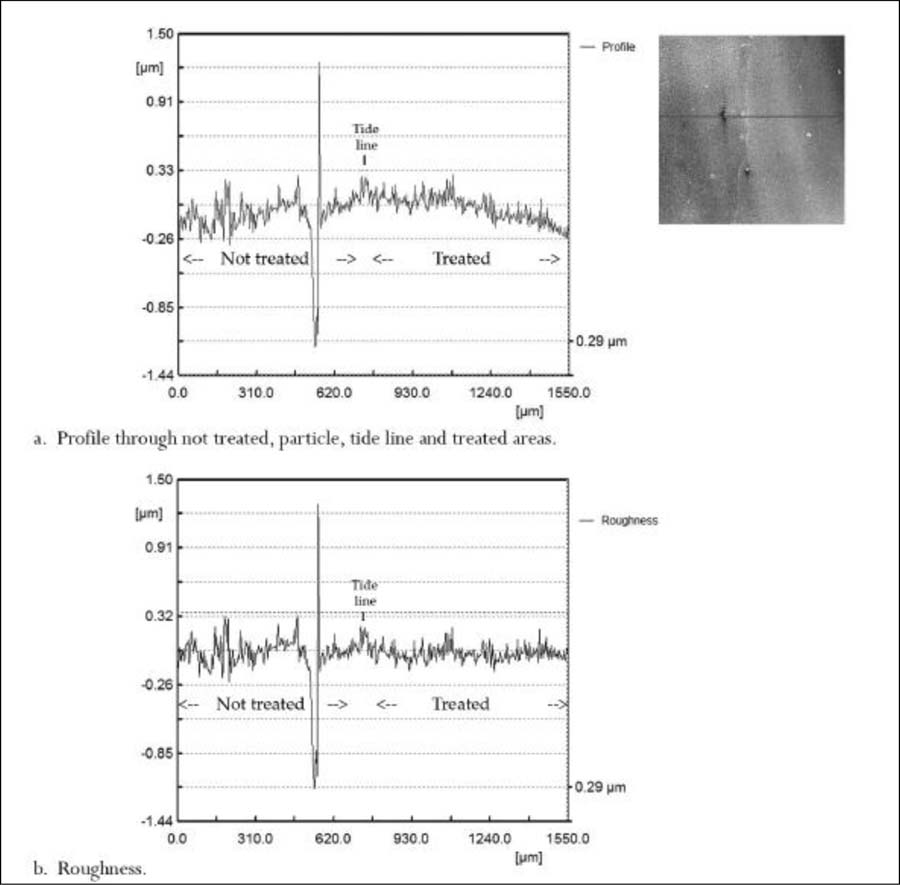
Figure 6. Low contrast transition area of the chin and neck profiles (2D). a. Profile through not-treated, tide line, and treated areas; b. Roughness extracted from profile b.
The central and right images in figure 5 show the contour and isometric views of the confocal data of the untreated and treated areas of the chin and neck. The two views show the surface character of both sides. The untreated side of the contour view shows a scale-like texture. Both contour and isometric views show how much smoother the treated side has become after treatment. An interesting feature of the two large particles in the center area is the apparent moat around them as seen in the isometric view, figure 5 right image. The profile, figure 6a, and the roughness, figure 6b, were chosen to include the lower large particle close to the tide line, figure 5 central image. Three distinct regions, excluding the large particle hill and valley, are an untreated left side, a short tide line in the middle, and a treated right side. The untreated left side is the noisiest, as would be expected; the tide line is short, slightly raised, and noisy; and the treated side is the smoothest and least noisy. The roughness graph, figure 6b, shows the three regions better than the profile. The tide line appears as thin and slightly raised above both the not-treated and treated areas. This slight increase suggests that some silver oxide was dissolved and redeposited at the tide line.
The changes observed in this case are not as dramatic as in the two earlier examples yet it demonstrates that the confocal microscope can follow minute nanometer range changes occurring on the surface.
The final example describes the left side of the jacket and shirt, an area of high contrast, figure 2. Figure 7a, left image, shows a dark field view of the jacket and shirt area. The two areas are separated diagonally from top left to bottom right, where the lower left light grey area is the jacket and the top right dark and scratched portion is the white shirt. The tide line runs from top to bottom in the center and can be seen clearly in the lower half. It is not readily visible in the top half. The whitish triangle at the bottom of the image is the obvious sign of where the jacket was cleaned by ammonium hydroxide. The scratched shirt area appears cleaner when comparing the lighter grey on the right half to the darker grey in the top left corner, but this is not as evident or dramatic as the whitish jacket triangle at the bottom.
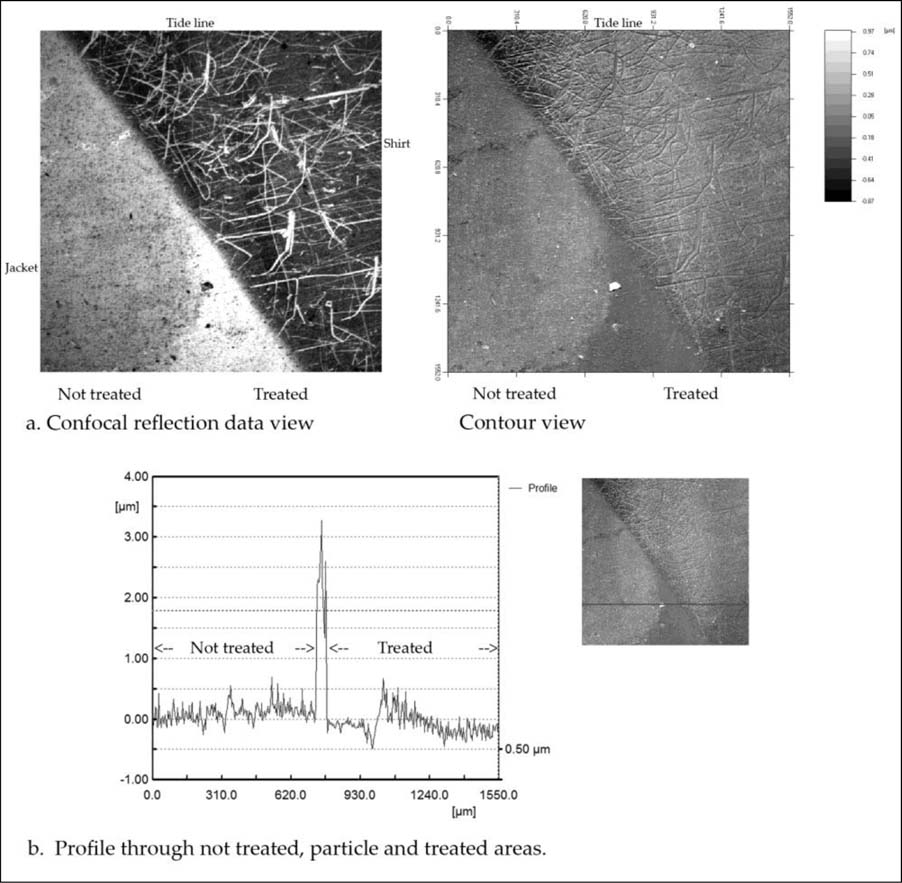
Figure 7. High contrast area of the left side of the jacket and shirt. a. Confocal reflection data and contour views; b. Profile (2D) through the particle.
The right image of figure 7a also shows the contour view of the confocal data showing the surface character of the jacket and shirt. It provides additional information on the smoothness of the cleaned dark mid tone area of the jacket; the texture of the treated scratched shirt side is not as apparent. Since highlight areas have a high concentration of image particles, perhaps this, the scratching damage, and the limitations of the microscope do not allow for a proper assessment of the cleaning that has taken place.
The profile in figure 7b shows several interesting features. It traverses a large particle in the lower half of the area. The profile does not display a transition area since the large particle occupies that area. The untreated area to the left presents a rough and noisy profile, and immediately to the right of the peak is the cleaned area, which is much smoother. Tribological roughness parameters are useful to quantitatively describe surface changes and are listed in Table 2 for equal portions of both not treated and treated profiles. The roughness average, Ra, and standard deviation, Rq, show a considerable decrease of 27% after treatment.
From the treated smooth dark mid tone jacket portion of the profile, there is a sharp transition to the highlight of the white shirt. The transition is interesting in that there is a short dip and then a fast rise leading to a new higher level, which slowly tapers off. This feature of differing levels between shadow and dark mid tone areas compared to highlight areas also has been observed in modern daguerreotypes. It is likely that it has to do with the chemistry of the daguerreotype process: when the iodized silver plate is exposed to light, silver metal forms only where light hits and dark and shadow areas remain as silver iodide. Mercury development yields a silver mercury amalgam and “fixing” with thiosulfate removes only silver iodide from all those areas that were shadows and dark areas. This removal of silver iodide from the dark areas that have few particles yields a lower baseline than that of the brighter mid tones and highlights, which have large groups of sub-micron particles thus providing a higher baseline.
Table 2. Roughness parameters for portions of the profile adjacent to each side of the large particle
| Profile taken from jacket area: | Ra (μm) | Rq (μm) |
| Not treated | 0.063 | 0.076 |
| Treated | 0.044 | 0.056 |
Not treated profile: length of profile, 0.120 mm; pts 40; min 0.030 μm; max 0.423 μm; range 0.394 μm; mean 0.190 μm.
Treated profile: length of profile, 0.110 mm; pts 36; min −0.173 um; max 0.099 μm; range 0.272 μm; mean −0.078 μm.
The optical and surface metrological technique of confocal microscopy has shown the potential to document and measure changes of the ultra-fine surface structure of the daguerreotype by non-contact, non-invasive, and non-destructive methods. This instrumental technique has many potential applications globally for the conservation and restoration of photographs in which fine surface features are defining characteristics. Optical metrology especially shows promise for quantitative evaluation of treatment regimens, and for condition monitoring of photographs in storage or on loan over term periods.
The case study presented here of the daguerreotype of the woman wearing a bonnet documented the surface changes resulting from treatment with an ammonium hydroxide solution (10 < pH < 10.5), that significantly removed the tarnish layers suspected to be silver chloride and silver oxide. Further studies using complementary non-destructive analytical methods, such as Raman spectroscopy and FTIR, would help identify the species that were removed and provide additional valuable data to this research into surface studies of the daguerreotype and treatment.
Speculatively, this technique could be used for attribution as well. The ultra-fine surface structure of a daguerreotype may “fingerprint” the working practice of a daguerreotypist through polishing patterns, image grain size and morphology, and other characteristic surface features.
Although conservators will continue to rely on qualitative methods to evaluate condition and the effects of treatment, research information derived from quantitative surface studies can significantly advance the field and train the eye. Perhaps the most important feature of the 3D topographical data of a daguerreotype is the direct correlation between the image and alteration or damage to the surface structure. It is this direct relationship that makes confocal microscopy a powerful, perhaps essential, instrument in the latest research on the science and conservation of daguerreotypes.
Barger, S., and W. B. White. 1991. The daguerreotype: 19th century technology and modern science. London: Johns Hopkins Press. 117–134
Centeno, Silvia 2007. Personal communication. Metropolitan Museum of Art, New York, NY.
Dick, L. F. P., H. Kaiser, and H. Kaesche. 1993. The tarnishing of Ag and AgAu-alloys in aqueous sulfide solutions and in H2S atmospheres. In Proceedings of the Second International Symposium on Corrosion and Reliability of Electronic Materials and Devices/1992, ed. J. D. Sinclair. Pennington, New Jersey: The Electrochemical Society. 406–414.
Egan, T. F., and A. Mendizza. 1960. Creeping silver sulfide. Journal of the Electrochemical Society 107: 353–354.
Fizeau, H. 1840. Comptes Rendus 11: 237.
Grynszpan, R. I., J. L. Pastol, S. Lesko, E. Paris, C. Raepsaet. 2004. Surface topology investigation for ancient coinage assessment using optical interferometry. Applied Physics A, 79: 273–276.
Gu, Min 1996. Principles of three-dimensional imaging in confocal microscopes. Singapore: World Scientific. 1–13.
Minsky, Marvin 1988. Memoir on inventing the confocal scanning microscope. Scanning 10: 128–138.
Motoyoshi, I., S. Nishida, L. Sharan, and E. H. Adelson. 2007. Image statistics and the perception of surface qualities. Nature 446 (7138): 831–948.
Selwyn, L. 2000. Corrosion chemistry of gilded silver and copper. In Gilded metals: History, technology and conservation, ed. T. Drayman-Weisser. London: Archetype. 21–47.
Sotiropoulo, S., Wei W. 2006. Non-contact method for the documentation, evaluation and monitoring of conservation treatments for icons. In Icons: Approaches to research, conservation and ethical issues, international conference held at Benaki Museum, ICOM Hellenic National Committee, Athens, December 3 - 7, 2006. In press.
Wei, W., S. Stangier, and A. de Tagle. 2005. In situ characterization of the surface of paintings before and after cleaning using white light confocal profilometry. In Non destructive investigations and microanalysis for the diagnostics and conservation of the cultural and environmental heritage, Art '05, Lecce, (Italy), May 15 - 19, 2005. In press.
Wilson, Tony 2002. Confocal microscopy: Basic principles and architectures. In Confocal and two-photon microscopy: Foundations, applications and advances, ed. A. Diaspro. New York: Wiley-Liss. 19–38.
The Andrew W. Mellon Foundation and the Advanced Residency Program in Photograph Conservation, George Eastman House for fellowship support.
The Foundation of the American Institute for Conservation (FAIC) for partial travel support. Dr. C. Wichern and D. Hoffman, NanoFocus, AG, for their generous assistance and use of the μsurf confocal microscope.
Patrick Ravines*, Ralph Wiegandt, and Grant Romer
George Eastman House International Museum of Photography & Film, Conservation Department, 900 East Avenue, Rochester, New York, USA 14607
* To whom correspondence should be addressed.
Christian M. Wichern
NanoFocus, Inc., 4470 Cox Road, Suite 250, Glen Allen, VA 23060, Telephone: 1–804-228–4195, ext. 217; Fax: 1–804-527–1816; www.nanofocus.info
Richard Hailstone
Nanoimaging & Materials, Chester F. Carlson Center for Image Science, Rochester Institute of Technology, 54 Lomb Memorial Dr., Rochester, NY 14623
Papers presented in Topics in Photographic Preservation, Volume Twelve have not undergone a formal process of peer review.